Adding data visualization on your WordPress site can transform complex information into engaging charts and infographics, making it easier for your audience to understand and interact with your data.
Depending on your goals, there are several WordPress plugins and tools you can use to create graphs, charts, and infographics. However, with so many options, deciding can be hard.
That is why we tested popular data visualization tools on real websites and evaluated them for factors like ease of use, features, customization, pricing, and more. This helped us determine the strengths and weaknesses of each plugin.
In this article, we will share some of the best data visualization WordPress plugins and tools so you can choose the right one for your business.

If you are in a hurry, then take a quick look at our expert picks to make a decision:
| # | Plugins | Best For | Pricing |
|---|---|---|---|
| 🥇 | WPForms | Displaying survey + poll data as charts or graphs | $49.50/year |
| 🥈 | Formidable | Complex forms + data visuals for advanced users | $39.50/year |
| 🥉 | Visualizer | Free graphs and charts | $99/year + Free |
| 4 | wpDataTables | Allows users to input values for tables and graphs | $55/year |
| 5 | Graphina | Includes charts and graphs in template pages | $19 + Free |
| 6 | iCharts | Free charts to display your data | $19/year + Free |
| 7 | Data Tables | Create tables for products in an online store | Free |
What Is Data Visualization?
Data visualization simply means turning numbers into graphics like charts, tables, interactive graphs, and infographics.
Creating a visual representation of data can make it much easier to spot trends and patterns. This helps you to figure out what your data is telling you.
For instance, when you look at Google Analytics to see how your website is doing, you’ll likely see a line graph. This might show an upward trend in traffic over the past six months.
You could use data visualization to enhance your blog posts, to let visitors interact with your site, or even to create an email optin like a special report. This can help you build your audience and make money from your website.
Some of the tools we will cover can also be used to create dynamic charts and tables that change based on the user’s input.
How We Tested and Reviewed Plugins for Data Visualization
At WPBeginner, we tested some popular data visualization plugins that let you display your data in beautiful charts, graphs, and infographics. During this process, we examined the following factors:
- Ease of Use: We have included plugins for beginners and small businesses that are easy to use and come with extensive documentation.
- Features: We have added plugins that offer most of the functionality you will need to display your data in multiple ways. For example, some of these tools allow you to easily generate colorful charts, engaging infographics, and more.
- Performance: Some data visualization plugins can slow down your website and load infographics really slowly. That is why we tested plugins for their impact on website speed and performance.
- Reliability: We only included plugins that we thoroughly tested ourselves on real websites, including our personal business sites.
- User Reviews and Ratings: We analyzed user feedback and ratings for each tool from the WordPress plugin repository to gather insights into user satisfaction and common issues faced by users.
Why Trust WPBeginner?
WPBeginner’s team of WordPress experts has 16+ years of experience in eCommerce, blogging, search engine optimization, online marketing, and much more.
When it comes to analytics, we are constantly tracking our websites using the latest software and tools. That way, we can identify trends and issues to improve the user experience.
What’s more, our team extensively reviews each plugin and thoroughly tests them on real websites to give you the most accurate and up-to-date recommendations. For more details, see our complete editorial process.
Now, let’s take a look at some of the best WordPress data visualization plugins.
1. WPForms: Survey and Polls Addon

WPForms is a form builder plugin with both free and premium versions. We’ve included it on this list because its Survey and Polls addon lets you display data as beautiful visuals.
At WPBeginner, we love WPForms and use it regularly for our contact form needs. We even use it to run our annual survey. To learn more, check out our WPForms review.
In order to access WPForms’ data visualization features, you’ll first need to create a form and collect data.
To run a poll or survey, you’ll need to sign up for a WPForms Pro account (or higher) through the WPForms site. Once you’ve done that, you can download and install the plugin on your site.
Next, you’ll need to install the Survey and Polls addon. Go to WPForms » Addons in your WordPress dashboard to install and activate it.
One of the great things about using WPForms to create surveys is that your existing forms can easily be turned into surveys. This could save a lot of time if you already have a form you are using to gather data.
For more details, you can follow our instructions on how to create a survey in WordPress.
We like WPForms because it gives you multiple ways to display your data. You are not limited to just one type of graph or chart.
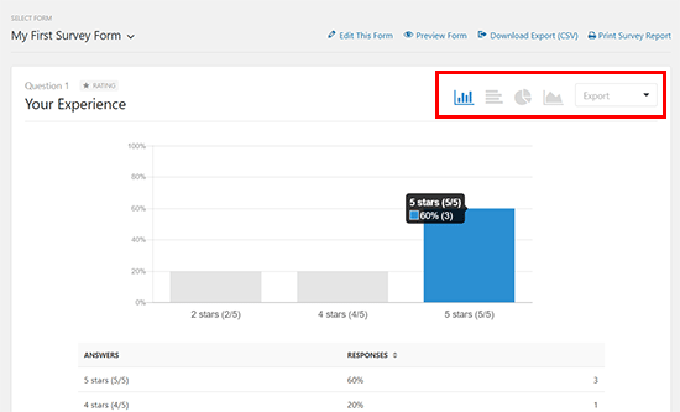
Plus, you can download your graphs and charts in various formats, like JPG and PDF. This makes it easy to use your results in blog posts and with colleagues, your boss, or clients.
Why we recommend WPForms: WPForms is the perfect data visualization plugin if you want to pull your information from surveys and polls. You can easily create your forms with the drag-and-drop builder, then display your findings using straightforward charts and graphs.
2. Formidable Forms

Formidable Forms is an advanced forms plugin for WordPress. After you collect information using forms, you can easily display it as data visuals like graphs, charts, and even heatmaps.
We have tried and tested this plugin extensively when writing other posts on our blog. We even did a deep dive for our complete Formidable Forms review. Although this tool is not as user-friendly as WPForms, we really like it and recommend it to our more advanced users.
When testing, we used it to create a whole range of different forms, including column graphs, horizontal bar graphs, line graphs, pie charts, area graphs, scatter graphs, histograms, stepped area graphs, and geographic heat maps.
The nice thing about Formidable Forms is that it lets you display the charts anywhere on your site using a shortcode. This makes it easy to put them into your site’s pages or posts.
During our research and testing, we found that you can style your graphs using different shortcode parameters. For instance, you can select the colors by adding hex codes to the shortcode. You can also filter graph data to be specific to different users.
Don’t worry if you are not very confident using shortcodes, though. Formidable Forms comes with a shortcode builder that lets you pick from a few dropdown lists to create your shortcode.
Why we recommend Formidable Forms: It is a great choice for anyone wanting to create a complex form or display a wide variety of data in different ways, such as calculators, data-driven apps, user listing tables, directories, and more.
That said, we generally recommend this to users who already have some experience in data analytics or form building, as its settings are a bit advanced for beginners.
3. Visualizer

Visualizer is a table and charts plugin for WordPress that lets you create interactive data visualizations for your site. This is our favorite free option, though there is also a premium tool available.
We love that the free version comes with multiple types of charts, including line charts, area charts, bar charts, column charts, pie charts, geo charts, table charts, bubble charts, and scatter charts.
Plus, we like that you can add these charts without installing any extra plugins.
If you opt for the pro version, you get extra chart types and email support. There’s also a full 30-day money-back guarantee if you don’t like it.
During testing, we discovered that you can also use Visualizer to create interactive tables for your site, such as a pricing table. Long tables can easily be paginated, and users can search and sort your tables.
Why we recommend Visualizer: It is the best option for creating graphs and charts for free. If you are just starting data visualization, the free version of Visualizer could be a great place to begin.
4. wpDataTables

The wpDataTables plugin might sound a bit complicated based on its name, but we found it just as easy to use as Excel.
It lets you add data and easily create charts and graphs that look great on both websites and mobile devices.
You can provide your data by uploading a file or typing it in. We were really impressed upon discovering that you can create tables that your user can edit. This will change the charts for them in real-time.
This plugin’s data filtering options are another standout feature. It lets you create filters for your data to easily show specific results from particular dates, locations, and so on.
We also appreciate that there’s lots of documentation and a “wizard” that takes you step by step through the process of creating a table of data.
There’s a lite version of the plugin available if you don’t want to pay for the premium version, but it has some limitations. For instance, your users can’t edit tables if you are using the lite version.
Why we recommend wpDataTables: This is an excellent option if you want to collect complex data for your tables and graphs. It’s ideal for letting users input values.
5. Graphina

Graphina is an Elementor charts and graphs plugin for WordPress. It offers powerful features yet makes sure attention to details like the performance and speed of your site shouldn’t affect the visual charts.
You get thousands of variations for charts and a dozen graph options. It adapts the design and style of your site to make the data look relevant.
If you’re using the popular Divi WordPress theme, then Graphina also provides charts and graphs for the Divi builder. It’s fully integrated with Divi and can also work seamlessly with other WordPress themes.
Why we recommend Graphina: It is great for including charts and graphs in your template pages with Elementor page builder or Divi builder
6. iChart

iChart is a free WordPress data visualization plugin that you can use to create a whole range of different charts. Our testing revealed that you can make several types of bar charts and area charts, plus line charts, pie charts, doughnut charts, polar area charts, and more.
We like the plugin’s chart builder, which lets beginners design beautiful charts and graphs. When testing, we noticed that you can add background colors for individual points and labels to create the best visualization for your data.
Once you’ve put in your data, you can use their shortcode generator to display charts in WordPress pages and posts. It’s easy to switch between the different charts and preview how they will look on any screen size, browser, or device.
Why we recommend iChart: This is an amazing plugin for creating a range of straightforward, free charts or graphs to display data on your website.
7. Data Tables Generator
The Data Tables Generator plugin, from WordPress plugin creator Supsystic, lets you create responsive tables. You’ll need the Pro version to create charts and graphs.
These are provided through Google Chart technology. You can create all the standard types of charts that you’d expect, like bar charts, pie charts, donut charts, and more.
You can also use data that you have in a spreadsheet elsewhere. We appreciate that the plugin supports importing from CSV, Excel, PDF, and Google Sheets.
One particularly handy feature is that the Data Table Generator integrates with WooCommerce. You can create product tables that users can easily search for.
Why we recommend Data Tables Generator: Creating tables of products in your WooCommerce store. These can be filtered and sorted by the user.
Bonus: Canva Infographics Maker Pro

Canva is a powerful design tool that lets you make beautiful infographics, blog visuals, and other graphics with a completely drag-and-drop interface. Although it’s not a WordPress plugin, it’s a tool many bloggers use to create compelling visual content.
They also have pre-made templates for social media graphics for all platforms, posters, banners, flyers, PowerPoint presentations, and so much more.
It’s a top web design software for non-designers because of how easy it is to create something beautiful.
What Is the Best WordPress Data Visualization Plugin?
In our opinion, WPForms is the best data visualization plugin for creating graphs and charts with user data. It is beginner-friendly, offers spam protection, and even comes with premade templates for polls and surveys, making the process super easy.
However, to create free graphs, you can opt for Visualizer. Meanwhile, if you want to allow users to add values for graphs and charts, then wpDataTables is your best option.
Bonus: Best WordPress Guides for WordPress Data Analytics
We hope that this article helped you find the best data visualization plugin for your unique needs. You may also be interested in some additional guides on WordPress analytics:
- Important Metrics to Measure on Your WordPress Site
- How to See Search Analytics in WordPress (2 Easy Ways)
- How to Do A/B Split Testing in WordPress (Step by Step)
- How to Add Google Analytics Event Tracking in WordPress
- How To Properly Set Up eCommerce Tracking In WordPress
- How to Track User Engagement in WordPress with Google Analytics
If you liked this article, then please subscribe to our YouTube Channel for WordPress video tutorials. You can also find us on Twitter and Facebook.




Dennis Muthomi
ON this list, I will install Visualizer plugin to create interactive line charts for my site’s statistics pages.
This will help make my blogposts with statistics data more understandable.
Thanks for this list!!
WPBeginner Support
You’re welcome
Admin
Moinuddin Waheed
to make table I had switched back to the classical editor and had toggle on back and forth to Gutenberg.
since many good options are there for making visual graphics and charts, it will be easy to make visually appealing presentation like we do make on power point presentations.
It is really helpful, thank you.
Jiří Vaněk
Thanks for adding the Graphina plugin. I’ve been looking for an extension for Elementor Pro for a long time, so I could make tables with it. Until now, I solved it externally, when I first had to create the html code and manually insert it into Elementor. This really makes my job a lot easier.
WPBeginner Support
Glad the recommendation was helpful
Admin