As a team who have been developing WordPress sites for over a decade, we’ve learned that finding and fixing performance issues can be tricky.
When we first started troubleshooting slow WordPress sites, we spent countless hours trying to figure out what was causing the problems. That’s when we discovered Query Monitor – a tool that completely changed how we debug WordPress sites.
If you’re struggling with a slow WordPress site or want to understand what’s happening under the hood, then you need a reliable debugging tool.
We think of it like getting an x-ray that shows all the hidden things going on behind the scenes – database queries, slow-loading scripts, plugins that might be hogging resources, all those potential bottlenecks.
We’ve tested dozens of debugging plugins over the years, and in this guide, we’ll show you exactly how to add Query Monitor to your WordPress site. Plus, we’ll share some practical tips on how to use it effectively to improve your site’s performance.
Whether you’re a developer or site owner, you’ll find this tool incredibly useful for keeping your WordPress site running smoothly.
What Is WordPress Query Monitor?
A WordPress query monitor is a debugging tool that monitors the requests your WordPress website makes to the server.
You can then use this information to troubleshoot WordPress issues or find and fix common WordPress errors.
Some of the things you can look up are:
- Database queries triggered by a page in WordPress
- HTTP requests made by scripts in your themes or plugins
- Hooks and actions triggered on a page
- Language, user role checks, and template files used to display the page
- Your hosting environments like PHP and MySQL versions, memory limits, and more
That being said, let’s take a look at how to add a query monitor on your WordPress site.
Adding Query Monitor in WordPress
The first thing you need to do is install and activate the Query Monitor plugin. For more details, see our step-by-step guide on how to install a WordPress plugin.
Upon activation, the plugin will add the query monitor menu to your WordPress admin bar.
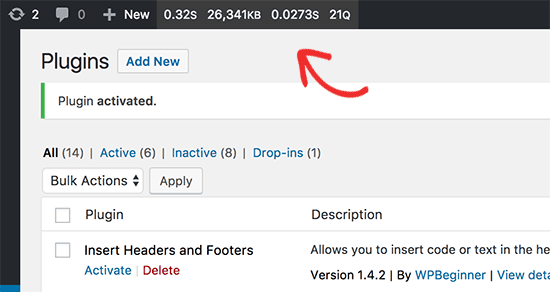
Taking your mouse over to the query monitor will display the menu, allowing you to jump to a parameter quickly. You can also click on the query monitor stats to view all data.
Viewing Data in WordPress Query Monitor
First, you need to make sure that the WordPress admin bar is visible when you are viewing your website. Simply go to the Users » Your Profile page and check the box next to the ‘Show Toolbar when viewing site’ option.
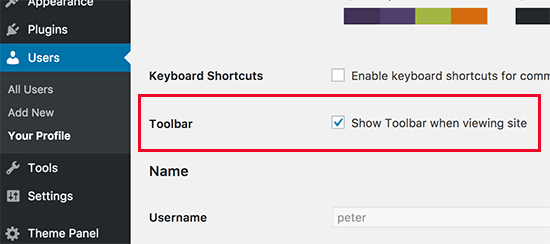
Don’t forget to click on the ‘Update profile’ button to store your settings.
Next, you need to visit the page you want to check the queries for. Once on this page, simply take the mouse over to the query monitor menu in the admin bar and click on the section you want to view.
Monitoring SQL Queries
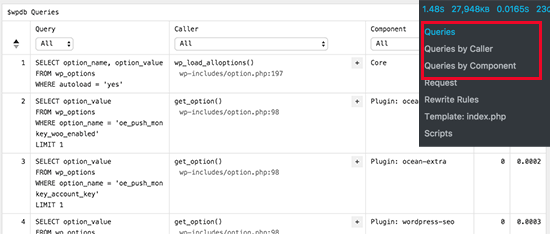
The Query Monitor plugin enables you to monitor all SQL queries, the number of queries by caller, and queries by component. The queries by component section shows you the queries made by plugins, themes, and core files.
Rewrite Rules and Templates
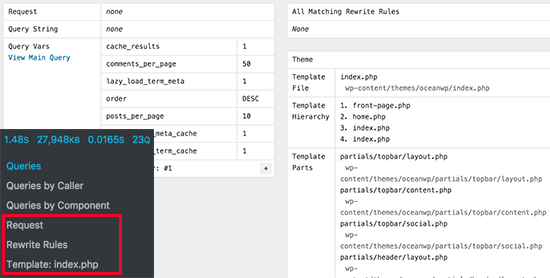
This section of the plugin shows you matching rewrite rules and the templates being used to display the current page.
Scripts and Styles
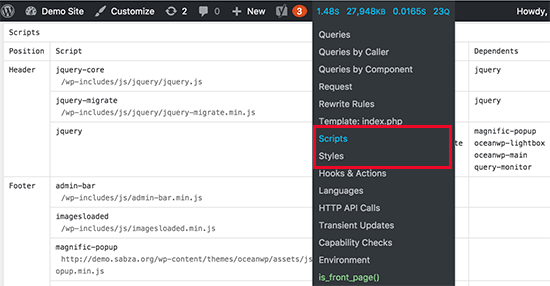
The Scripts and Styles section shows you the JavaScript and stylesheets loaded by your theme and plugins.
You will also see where these files are loaded, for example, in the header or footer.
Hooks and Actions
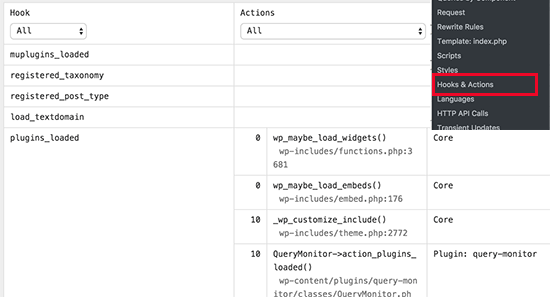
The Hooks and Actions section shows you the hooks used and actions triggered while loading the current page.
Languages Section
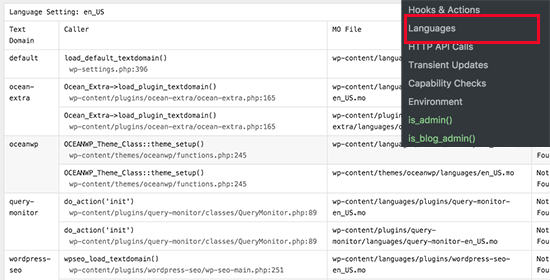
This section shows you the language files requested and loaded by the current page.
If you run a multilingual WordPress site, then this helps you figure out which themes and plugins have language files available.
HTTP API Calls
This section displays HTTP API calls made to third-party API libraries.
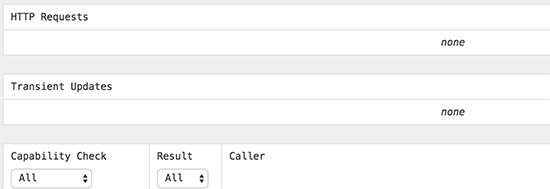
Transient Updates
A transient API allows developers to store information in your WordPress database with an expiration time. This section displays any transient updates requested during the current page load.
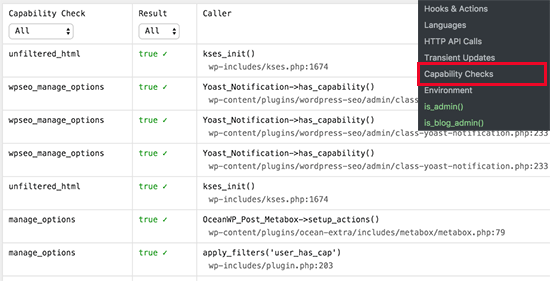
Capability Checks Section
The Capability Checks section displays user capabilities checks run by WordPress core, plugins, and themes while loading the current page.
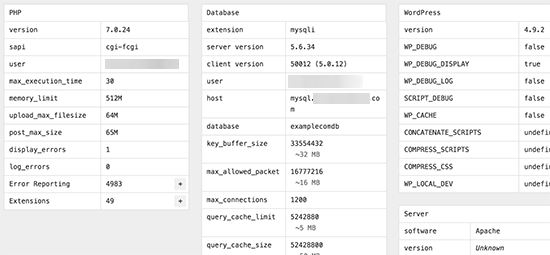
Environment Section
This is where you will get your WordPress hosting environment information, like the PHP version, MySQL version, MySQL Host, WordPress database name, and more.
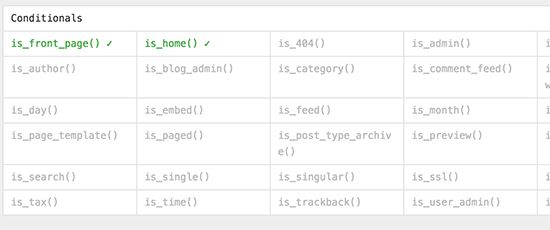
Conditional Checks
This is where the plugin shows conditions that were required to display the current page view.
We hope this article helped you add a query monitor to your WordPress site. You may also want to see our guide on how to optimize Core Web Vitals for WordPress and our expert pick of the best WordPress caching plugins to speed up your website.
If you liked this article, then please subscribe to our YouTube Channel for WordPress video tutorials. You can also find us on Twitter and Facebook.




Luke Cavanagh
When you do not need to find slow queries on your site, deactivate Query Monitor, if left active it can decrease performance on the site and increase memory usage.