WordPressサイトで棒グラフや円グラフを作成することで、データにアクセスしやすくなり、コンテンツが改善されます。視覚的に魅力的で、ユーザーが理解しやすい方法で情報を提示することができます。
良いニュースは、これを行うために技術的な経験が必要ないことです。Visualizerのようなプラグインを使えばいいのです。このツールは私たち自身でテストしたことがあり、プロセスがとても簡単で気に入りました。
Visualizerを使用すると、さまざまなソースからデータを簡単に取り込んで、魅力的なカスタムバーやチャートを作成できます。こうして、コンテンツと全体的なユーザー体験を向上させることができます。
この記事では、WordPressでVisualizerを使って棒グラフやチャートを作成する方法を紹介します。

WordPressにおけるバーとチャートの問題点
コンテンツに棒グラフやチャート、グラフを追加するプラグインはたくさんあります。しかし、私たちがユーザーから聞いた最も一般的な不満は、これらのプラグインは通常、使い方が複雑すぎるということです。
これらのプラグインの中には、ユーザーが非常に複雑なフォーマットでショートコード内にデータを追加することを期待するものさえある。
そのようなプラグインを使う代わりに、多くのユーザーはオフィスアプリケーションでチャートを作成し、WordPressウェブサイト用に画像に変換している。
一度も変更しないつもりなら、これは有効かもしれない。しかし、画像は、ユーザーが特定の部分をクリックすると役立つデータが表示されるインタラクティブなチャートの代わりにはなりません。
理想的なチャートとグラフのソリューションは、以下を可能にする:
- コンピューターやウェブ上のデータソースからデータを追加します。
- データを使ってチャート、パイ、グラフ、バーを作成します。
- 美しく、インタラクティブで、カラフルで、モバイルフレンドリーなグラフを作成できます。
- 最も重要なのは、いつでも好きなときにデータを更新できることだ。
ビジュアライザーでチャートを追加すれば、ユーザーのエンゲージメントを高め、データを理解しやすくすることもできます。
それでは、WordPressサイトに棒グラフを簡単に追加する方法を見てみよう。
WordPressでビジュアライザーを使って棒グラフを作成する方法
Visualizerプラグインを使用すると、WordPress で棒グラフやチャートを簡単に作成できます。これは、あなたのサイトにインタラクティブなデータビジュアライゼーションを作成できる、市場で最高のWordPressデータビジュアライゼーションプラグインです。
棒グラフやチャートを作成するための無料プランもある。
まず、Visualizerをインストールして有効化する必要があります:Tables and Charts Manager for WordPressプラグインをインストールし、有効化する必要があります。詳細については、WordPress プラグインのインストール方法のステップバイステップガイドを参照してください。
注:このチュートリアルでは、プラグインの無料版を使用します。プロフェッショナルな機能のロックを解除したい場合は、有料プランを購入してください。
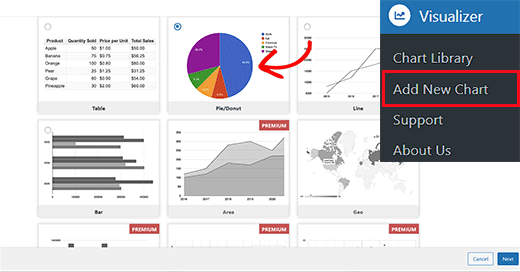
有効化した後、WordPress ダッシュボードからVisualizer ” Add New Chartページにアクセスする必要があります。
そこで、表、円グラフ、折れ線グラフ、棒グラフなど、作成したいグラフのタイプを選択する。そして「次へ」ボタンをクリックする。
次のステップに進みますので、「ファイルを選択」ボタンをクリックして、コンピューターからエクセルのスプレッドシートデータをインポートしてください。
ExcelやGoogleスプレッドシートをCSVファイルとして保存している場合は、「Import data from URL」タブを展開してインポートすることができます。
そうしたら、「CSVからインポート」ボタンをクリックします。次に、CSVファイルのURLを入力して、ファイルを埋め込みます。
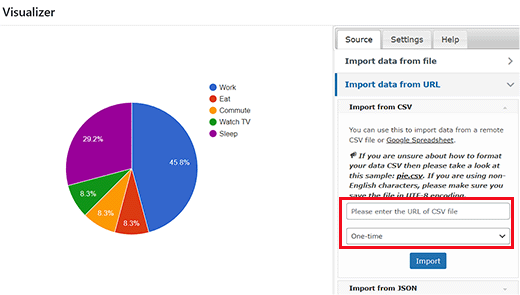
CSVファイルは、1行目にカラム名、2行目にデータ型が必要です。プラグインは以下のデータ型をサポートしています:文字列、数値、ブーリアン、日付、時刻、時刻。
Google Sheetsで作成したファイルの例をご覧ください。
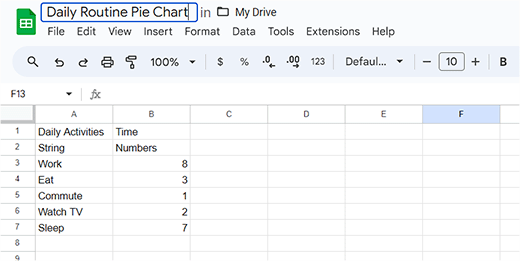
テキストエディターを使ってCSVファイルを作成する場合は、このCSVファイルの例を見てください:
日々の活動,時間
 文字列,数字
 仕事,8
 睡眠,7
 食事,3
テレビを見る,2
通勤,1
しかし、Googleドライブにチャートデータをスプレッドシートとして保存している場合は、エクスポートせずにチャートに追加することができます。
まず、Googleスプレッドシートでデータファイルを開き、ファイル ” 共有 ” ウェブに公開する のリンクをクリックします。
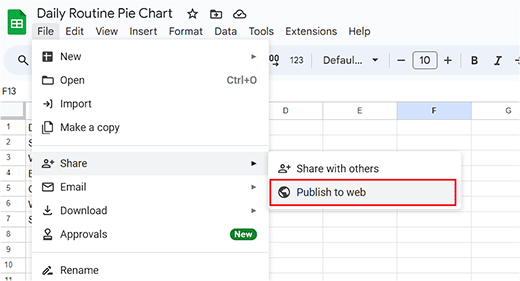
ポップアップが表示され、このドキュメントの公開方法を選択する必要があります。
ドロップダウンメニューからカンマ区切り値(.csv)オプションを選択し、「公開する」ボタンをクリックするだけです。
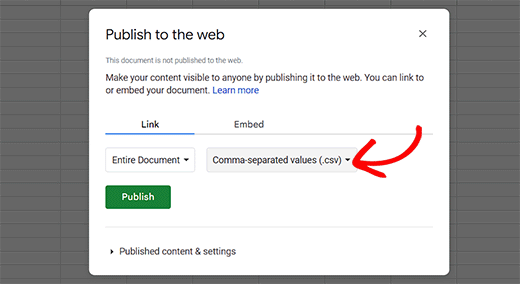
シートの公開 URL が CSV ファイルとして表示されます。この URL をコピーして、ビジュアライザー・チャートに戻ってください。
このURLを「CSVからインポート」フィールドに追加する必要があります。
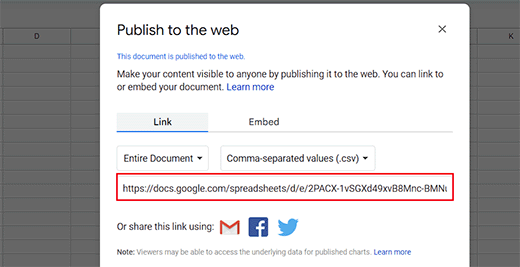
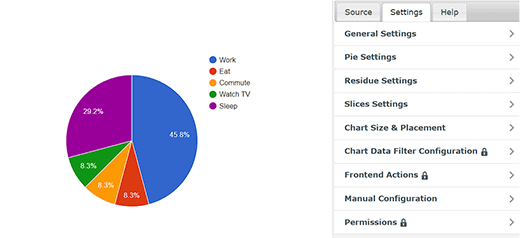
URLを入力すると、プラグインがCSVファイルを取得し、チャートのライブプレビューを表示します。
これで、上部から「設定」タブに切り替えて、フォントスタイル、数字フォーマット、サイズと配置、サイズ設定など、一般的な設定を行うことができる。
完了したら、プロンプトの下部にある「作成」ボタンをクリックします。
WordPressの投稿/ページに図表を追加する
WordPressの投稿やページに図表を追加するのは、画像を追加するのと同じくらい簡単です。
まず、円グラフを追加したい新規または古いページ/投稿を開きます。画面左上の「ブロックを追加」(+)ボタンをクリックします。
ブロック・メニューが開きますので、ビジュアライザー・チャート・ブロックを見つけて追加してください。
そうしたら、ブロック自体にある’Display an Existing Chart’ボタンをクリックする。
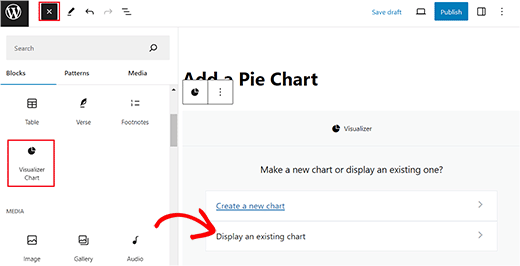
これでブロック内に新しいプロンプトが表示され、先ほど作成した円グラフを選択する必要があります。
最後に、「公開する」または「更新する」ボタンをクリックして、設定を保存します。
これで、WordPressサイトにアクセスして、円グラフを実際に表示することができる。
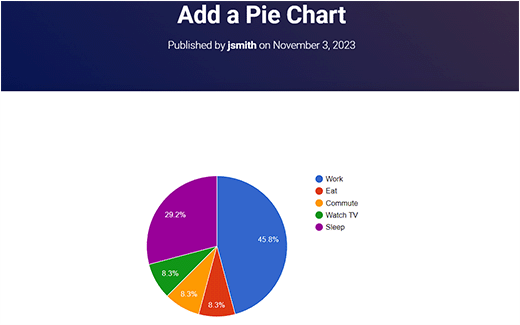
WordPressでビジュアライザー・チャートを編集する
チャートはいつでも編集・変更できます。WordPress ダッシュボードからVisualizer ” Chart Libraryページにアクセスするだけです。
そこから、チャート名の下にあるアイコンを使って、チャートのクローン、削除、ビジュアル設定の編集ができます。
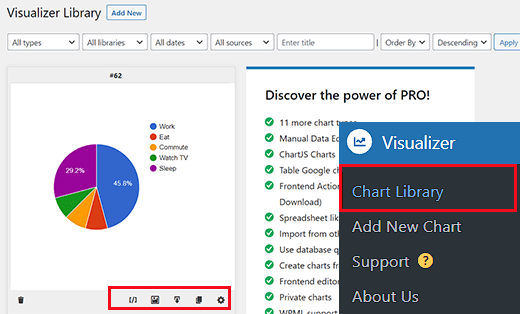
チャートを変更することなく、既存のチャートのデータを更新することも、ビジュアライザーを使えば非常に簡単です。
Googleスプレッドシートからデータを追加した場合は、スプレッドシートのデータを更新し、ファイル ” 共有 ” ウェブに公開オプションに進み、スプレッドシートを再公開するだけです。
変更内容は自動的にチャートに反映されます。
一方、CSVファイルをアップロードした場合は、コンピューター上でCSVファイルを更新する必要があります。更新したいチャートを選択し、チャートの下にある編集リンクをクリックしてください。
CSVファイルのインポート」セクションで、新規CSVファイルをアップロードしてください。データの変更は、そのグラフを挿入した投稿やページに自動的に反映されます。
ボーナス:WordPressで会社の組織図を作成する
中小企業のサイトであれば、WordPressで会社の組織図を追加することもできます。このチャートは、CEOから 各チーム、各チーム内の従業員まで、あなたの会社がどのように構成されているかを示します 。
組織図は、潜在顧客があなたのビジネスについてさらに詳しく知るのに役立ち、チーム間のコミュニケーションを容易にします。

チャートを作成するには、Organization Chartプラグインをインストールして有効化するだけです。詳しくは、WordPressプラグインのインストール方法のチュートリアルをご覧ください。
有効化したら、Wpdevart Chart ” Chartsページにアクセスし、’Add New’ ボタンをクリックします。チャートの名前を追加する新しい画面が表示されます。
その後、画面上の要素にあなたの会社のCEOの画像とタイトルを追加します。その後、矢印アイコンをクリックしてください。

これにより、CEOの後に続く人物の肩書きと画像を追加できる別の要素が追加されます。次に、要素をもう一度クリックすると、異なる方向の複数の矢印アイコンが表示されます。
こうすることで、複数の支社やチームを持つ会社組織を作ることができる。
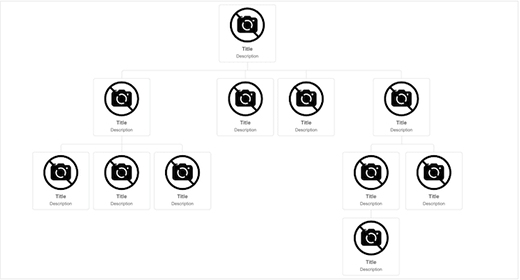
設定が完了したら、「保存」ボタンをクリックして設定を保存します。
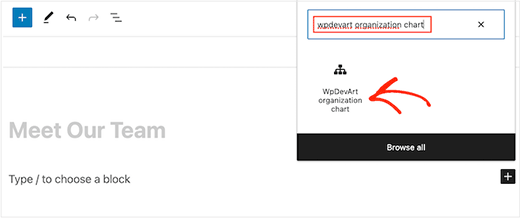
組織図を追加したいページを開き、「WpDevArt組織図」ブロックを追加します。次に、ブロック内のドロップダウンメニューから作成したチャートを選択します。
最後に、「公開する」または「更新する」ボタンをクリックして、設定を保存します。詳しくは、WordPressで組織図を作成する方法のチュートリアルをご覧ください。
この記事が、あなたのWordPressサイトに棒グラフを追加するのにお役に立てば幸いです。WordPress ウェブサイトの色をカスタマイズする方法についての初心者向けガイドや、WordPress のエキスパートが選ぶ、見逃している最高の楽しいプラグインもご覧ください。
If you liked this article, then please subscribe to our YouTube Channel for WordPress video tutorials. You can also find us on Twitter and Facebook.


Adam
I am able to generate the chart and publish it on my site, but how to I edit the height and width once the shortcode?
zulfi
thxs dude it help a lot
Judith Hollies
Thank you so much for this clear tutorial. I’m trying to create a pie chart in wordpress and have successfully activated the visualizer plug-in. But when I copy the info over from either excel or google drive (following your steps) both times the first row of stats is omitted in the pie chart. I’ve tried re-ordering the stats, placing them in different locations, but it’s always the first row that gets omitted! Can you help me! Judith
mandeep
How we comparison between two app like app A and app B and now for i want to make a graph chart both of them in blog of wordpress?How i do it?Can you tell me here?
Felix
Thanks for the review. How do you handle values with a comma eg. 2.232,42 if you have to use commata as a seperator for the Visualizer?
david
Hi Great plugin, I solved all my problems except one.
How do you edit a chart in the visualizer library, when I click on the edit icon all I get is a blank screen, is this just me – plugin conflict or something, or is there a problem with the Visualizer plugin
Any ideas?
Thanks
David
david
Hi, I’m trying to replicate your example above from “Adding a Chart in WordPress using a CSV file”, but when I click “From Computer” in “Upload csv file” and select the file I copied from your example I get: “CSV file is broken or invalid. Please, try again”
Any ideas what the problem may be, any help greatly appreciated.
Thanks
David
Richard G
Hello
Thank you for this post
However maybe you can help me for one of my client. He has a group of students, each one have a private area
My client wants to integrate somes customs fields. Basicly each student will enter his datas into this custom fields, and these datas will be convert into a chart or a curve (tracking weight loss or mass gain for exemple)
Any idea?
Thank you
Richard
Chad
Thanks for the great tutorial. When I drop down the “upload CSV file” I am unable to click on the button for “From Web”, as it is not highlighted in blue. So I must add the data “from Computer”. I noticed that in the screen shot above the “from Web” button is also not highlighted. Has anybody else had this problem and figured out a solution?
Thanks Again
Artur
Thanks a lot !!!!!!
I love you guys, you solve my very long issue.
Thanks for this excellent plugin.
Recommended to all.
Tom Horn
I use charts on my blog often so this really comes in handy. Thanks alot.
Jeff
How do you make the bars thicker?
Editorial Staff
You have to tweak the CSS.
Admin
Franco Castillo
I just downloaded the Visualizer plugin, and I opened it in Winrar. Can anyone tell me how to activate the plugin in Winrar?
Editorial Staff
Use this guide on how to install a plugin in WordPress
https://www.wpbeginner.com/beginners-guide/step-by-step-guide-to-install-a-wordpress-plugin-for-beginners/
Admin
Richard
Hello
Yes very interesting indeed thanks!
I have the same question (and sorry for my english), i need to create personnal charts from datas feed by a user thrue a table on the website(and insert the final chart in the profil page of the user). Do you think it can be done? do you have any clues?
Thanks
Husien Adel
thanks a lot
Ted
Really helpful.
Stephen
Great looking plugin. Have been waiting for something like this for ages.
How feasible is it to be able to read data from custom fields, instead of a CSV file or a Google Drive spreadsheet?
Is this a feature that you may consider implementing?
That way, data could be kept in the WordPress database, and be updated from the front end of the website.
For me, that would be really useful!
– Stephen
Eugene
Hi Stephen,
your idea is good and I will keep in mind it for future release. Could you, please, re post your request at the forum on support site? It will help us to keep all requests in one place.
Post it here: http://visualizer.madpixels.net/forums/forum/official-forums/feature-request/
– Eugene
Jotpreet Singh
hey, Awesome. Can this be done via google docs or any other online method. I’m running a blog on wordpress.com. Hope something, would come out. Do you have any ?